 bitlab Academy
What a moving average is
A moving average is the average closing price of the last N days. The 50-day average shows the medium-term trend and the 200-day average the long-term one. When price is above the 200-day line, the long-term trend is usually read as up.
Golden cross and death cross, tested
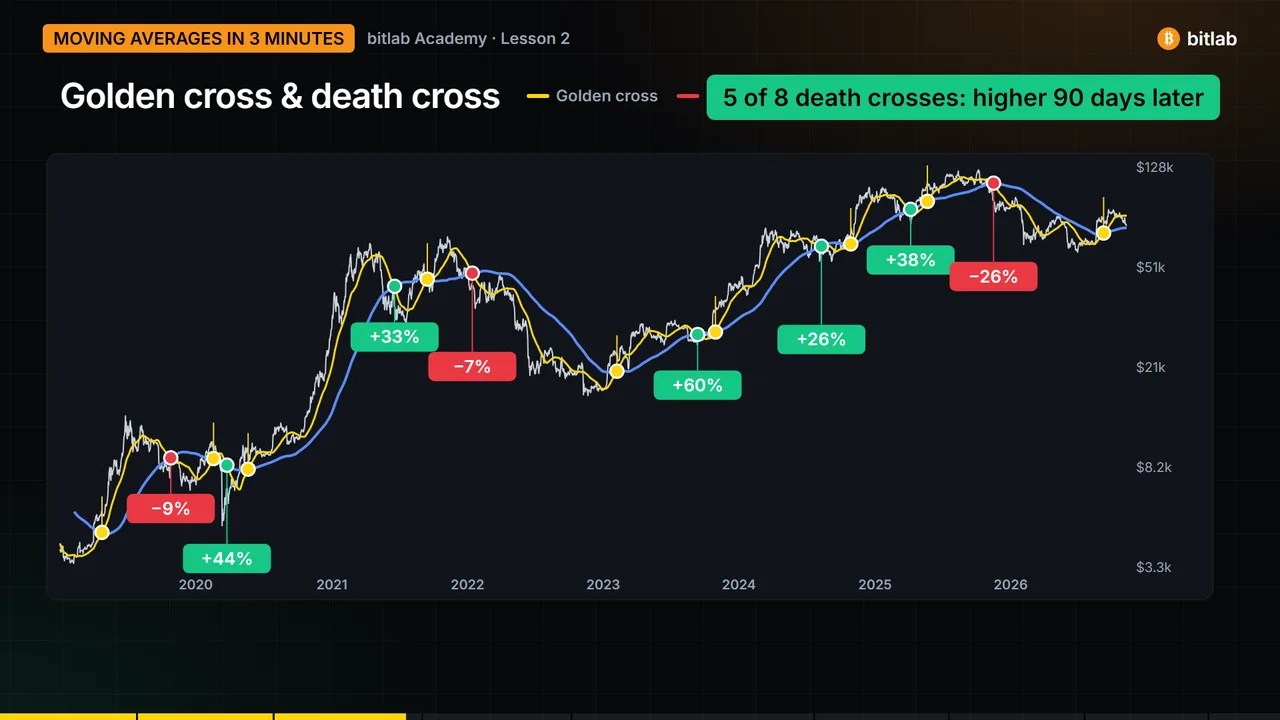
When the 50-day crosses above the 200-day it's called a golden cross (a classic buy signal). When it crosses below, a death cross (a classic sell signal). Bitcoin had 8 death crosses from 2019 to 2025. Ninety days later, the price was higher in 5 of them.
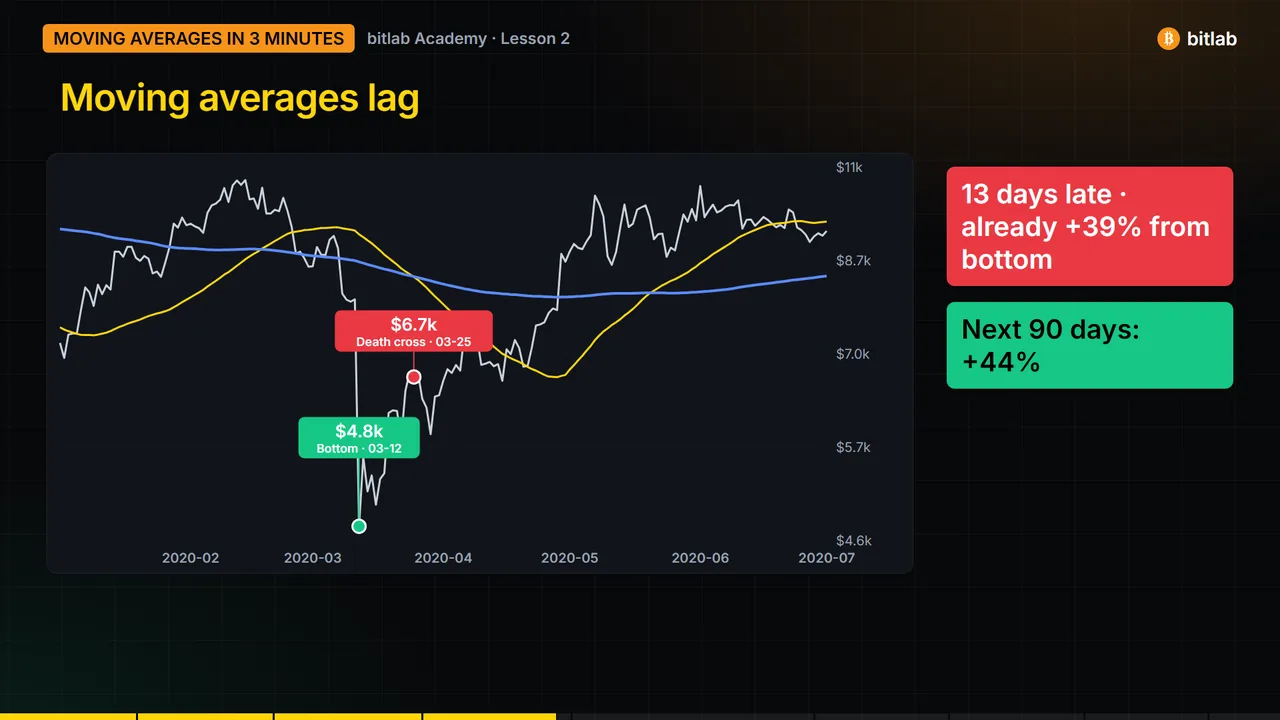
Why: moving averages lag
A 200-day average moves slowly. In March 2020 Bitcoin bottomed near $4,800 (March 12). The death cross came 13 days later (March 25), when price had already bounced about 39%. Over the next 90 days Bitcoin rose another 44%. Selling on that signal meant selling near the bottom.
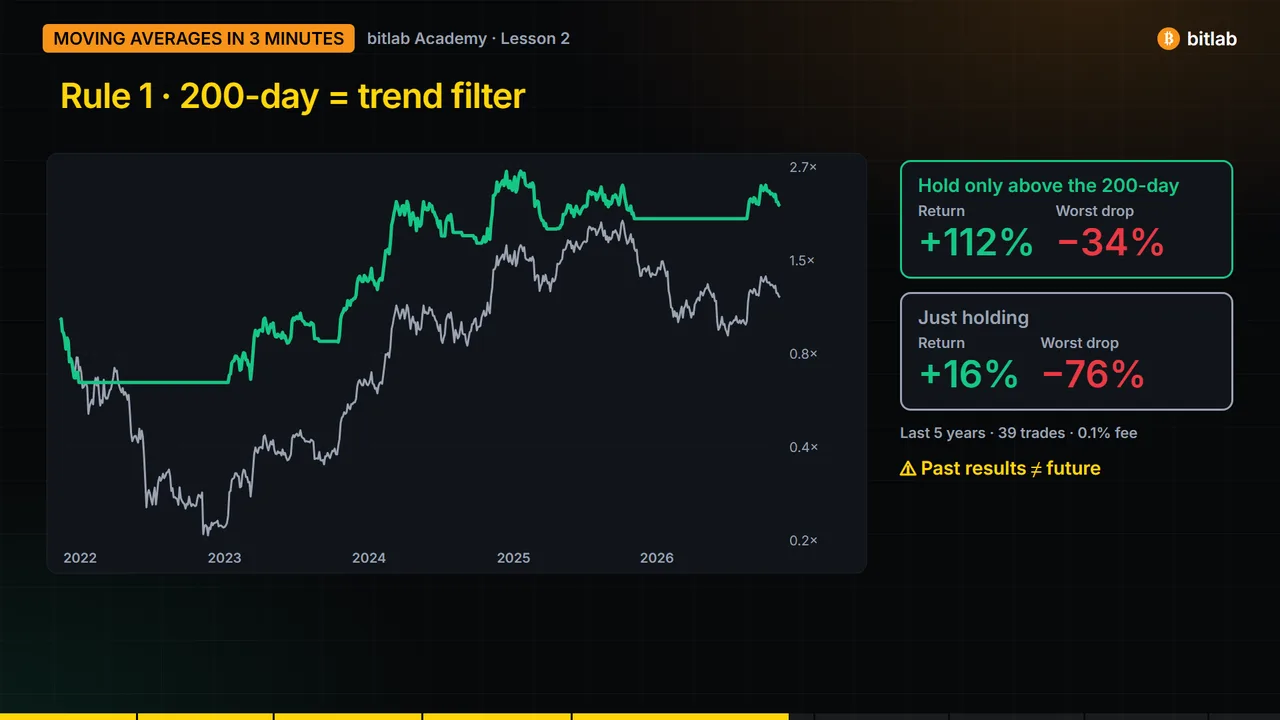
Rule 1: use the 200-day as a trend filter
Instead of trading the cross, use the 200-day line as a filter. We tested a simple rule over the last 5 years: hold Bitcoin only while the daily close is above its 200-day average, otherwise stay in cash (0.1% fee per trade, 39 trades). It returned about +112% versus +16% for just holding, and its worst drop was −34% instead of −76%. Past results don't guarantee future results.
Rule 2: expect fake breakouts
In the last 12 months Bitcoin closed above its 50-day average 10 times, and 5 of those fell back below within 10 days. Wait for a daily close and treat the average as a zone, not an exact line.
Rule 3: plan your exit
Let the average tell you where you're wrong: if you buy above the 200-day, a daily close back below it is your exit. Size the position so that loss stays small. Checklist: 200-day trend → 50-day timing → daily close → stop and size.
Practice what you learned
Test this setup on live Bitcoin prices with $10,000 in virtual money. Free, no deposit. Sign in with Google to join the monthly ranking.
Open the simulator →