 bitlab Academy
MomentumTrendPrice levelsVolume and volatilityCandles and chart patternsRisk management
Momentum
How strong is the move, and is it running out of steam?
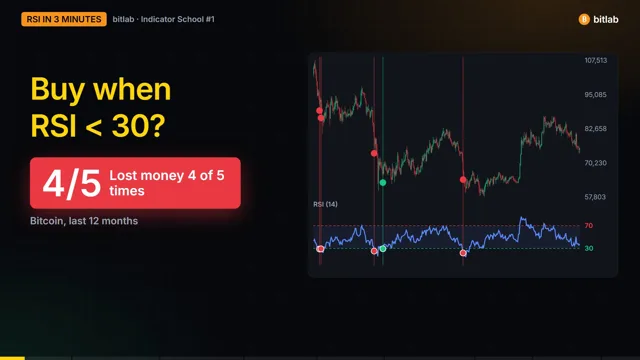 RSI · 3 minRSI explained: we tested "buy below 30" on Bitcoin (it failed 4 of 5 times)
The most famous RSI rule, tested on a year of real Bitcoin data, and three better ways to use RSI.
- MACDComing soon
- StochasticComing soon
Trend
Which way is the market going, and how to stay with it.
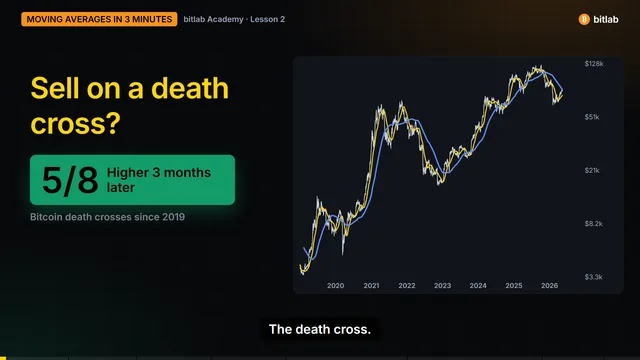 Moving averages · 3 minMoving averages explained: we tested the death cross on Bitcoin (5 of 8 went up)
Every Bitcoin death cross since 2019, why moving averages lag, and the 200-day rule that actually helped.
- TrendlinesComing soon
Price levels
Where price tends to stop, bounce or break.
- Support and resistanceComing soon
- Fibonacci retracementComing soon
Volume and volatility
Is the move backed by real money, and how wild is it?
- VolumeComing soon
- Bollinger BandsComing soon
- ATRComing soon
Candles and chart patterns
Reading what single candles and shapes on the chart suggest.
- Candlestick patternsComing soon
- Chart patternsComing soon
Risk management
The part that keeps you in the game.
- Stop-loss and position sizeComing soon