 bitlab Academy
What RSI measures
RSI (Relative Strength Index) compares how big the recent up days were against the recent down days, usually over the last 14 candles. The result goes from 0 to 100. Above 70, buyers have been in control for a while (“overbought”). Below 30, sellers have (“oversold”).
The classic rule, tested
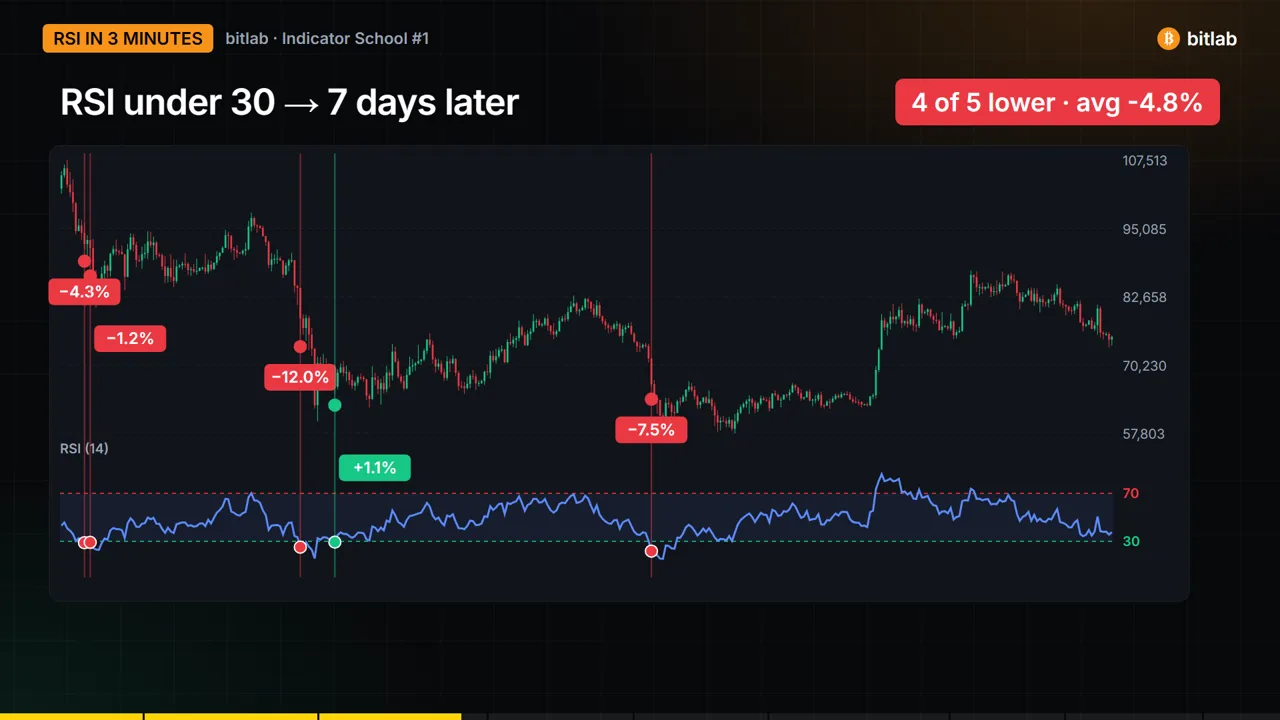
The textbook rule says: buy when RSI drops below 30, sell when it rises above 70. We checked every time Bitcoin's daily RSI crossed below 30 in the last 12 months. It happened 5 times. Seven days later, Bitcoin was lower in 4 of them, by about 4.8% on average.
Why it failed: the trend
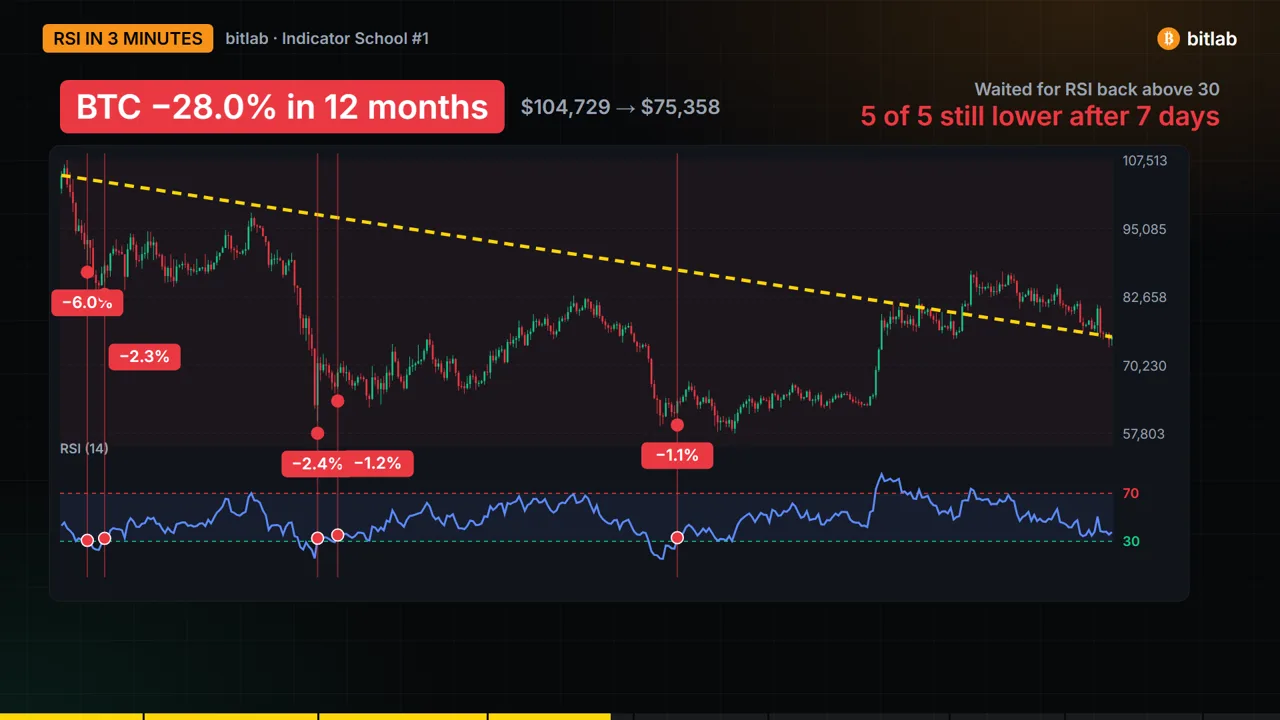
Bitcoin fell about 28% over this period. In a downtrend, “oversold” can stay oversold for weeks. Even waiting for RSI to climb back above 30 before buying didn't help: all five of those entries were lower a week later.
Rule 1: check the trend first
Read RSI inside the trend. In an uptrend, dips toward 30–40 can be buying zones. In a downtrend, RSI near 70 is more often where rallies stall.
Rule 2: watch for divergence
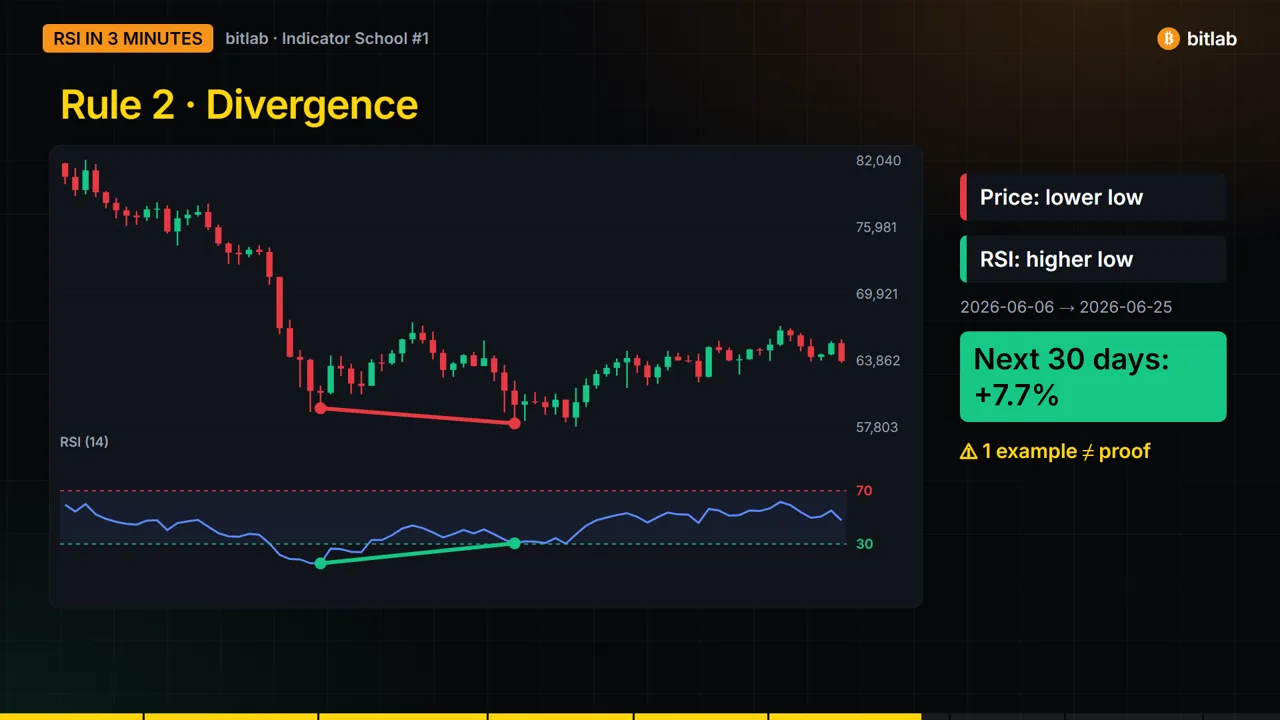
A bullish divergence is when price makes a lower low but RSI makes a higher low: selling pressure is fading. In June 2026 (June 6 → June 25) Bitcoin showed one, and over the next 30 days it rose about 7.7%. One example is not proof, so treat divergence as a warning light, not a guarantee.
Rule 3: plan your exit
RSI never tells you where you're wrong. Decide your stop-loss and position size before you enter. A simple checklist: trend → RSI level → divergence → stop.
Practice what you learned
Test this setup on live Bitcoin prices with $10,000 in virtual money. Free, no deposit. Sign in with Google to join the monthly ranking.
Open the simulator →